TLS-Anvil Result Analysis
Analyzing Servers and Clients Using Anvil Web
Introduction
This guide explains how to analyze TLS-Anvil scan reports using the Anvil Web interface.
Importing Reports into Anvil Web
If a scan was created and executed via the Anvil Web interface using a connected worker, the results will appear automatically in the report overview.
If the scan was executed using the command-line tool, it must be imported manually.
- Ensure a ZIP archive of the test output exists:
- If TLS-Anvil was started using the
-zipflag, the archive will be created automatically. - Otherwise, manually compress the output directory into a ZIP archive.
- The archive should resemble:
report.zip

- If TLS-Anvil was started using the
- Upload the ZIP archive under Tests → Upload Test.
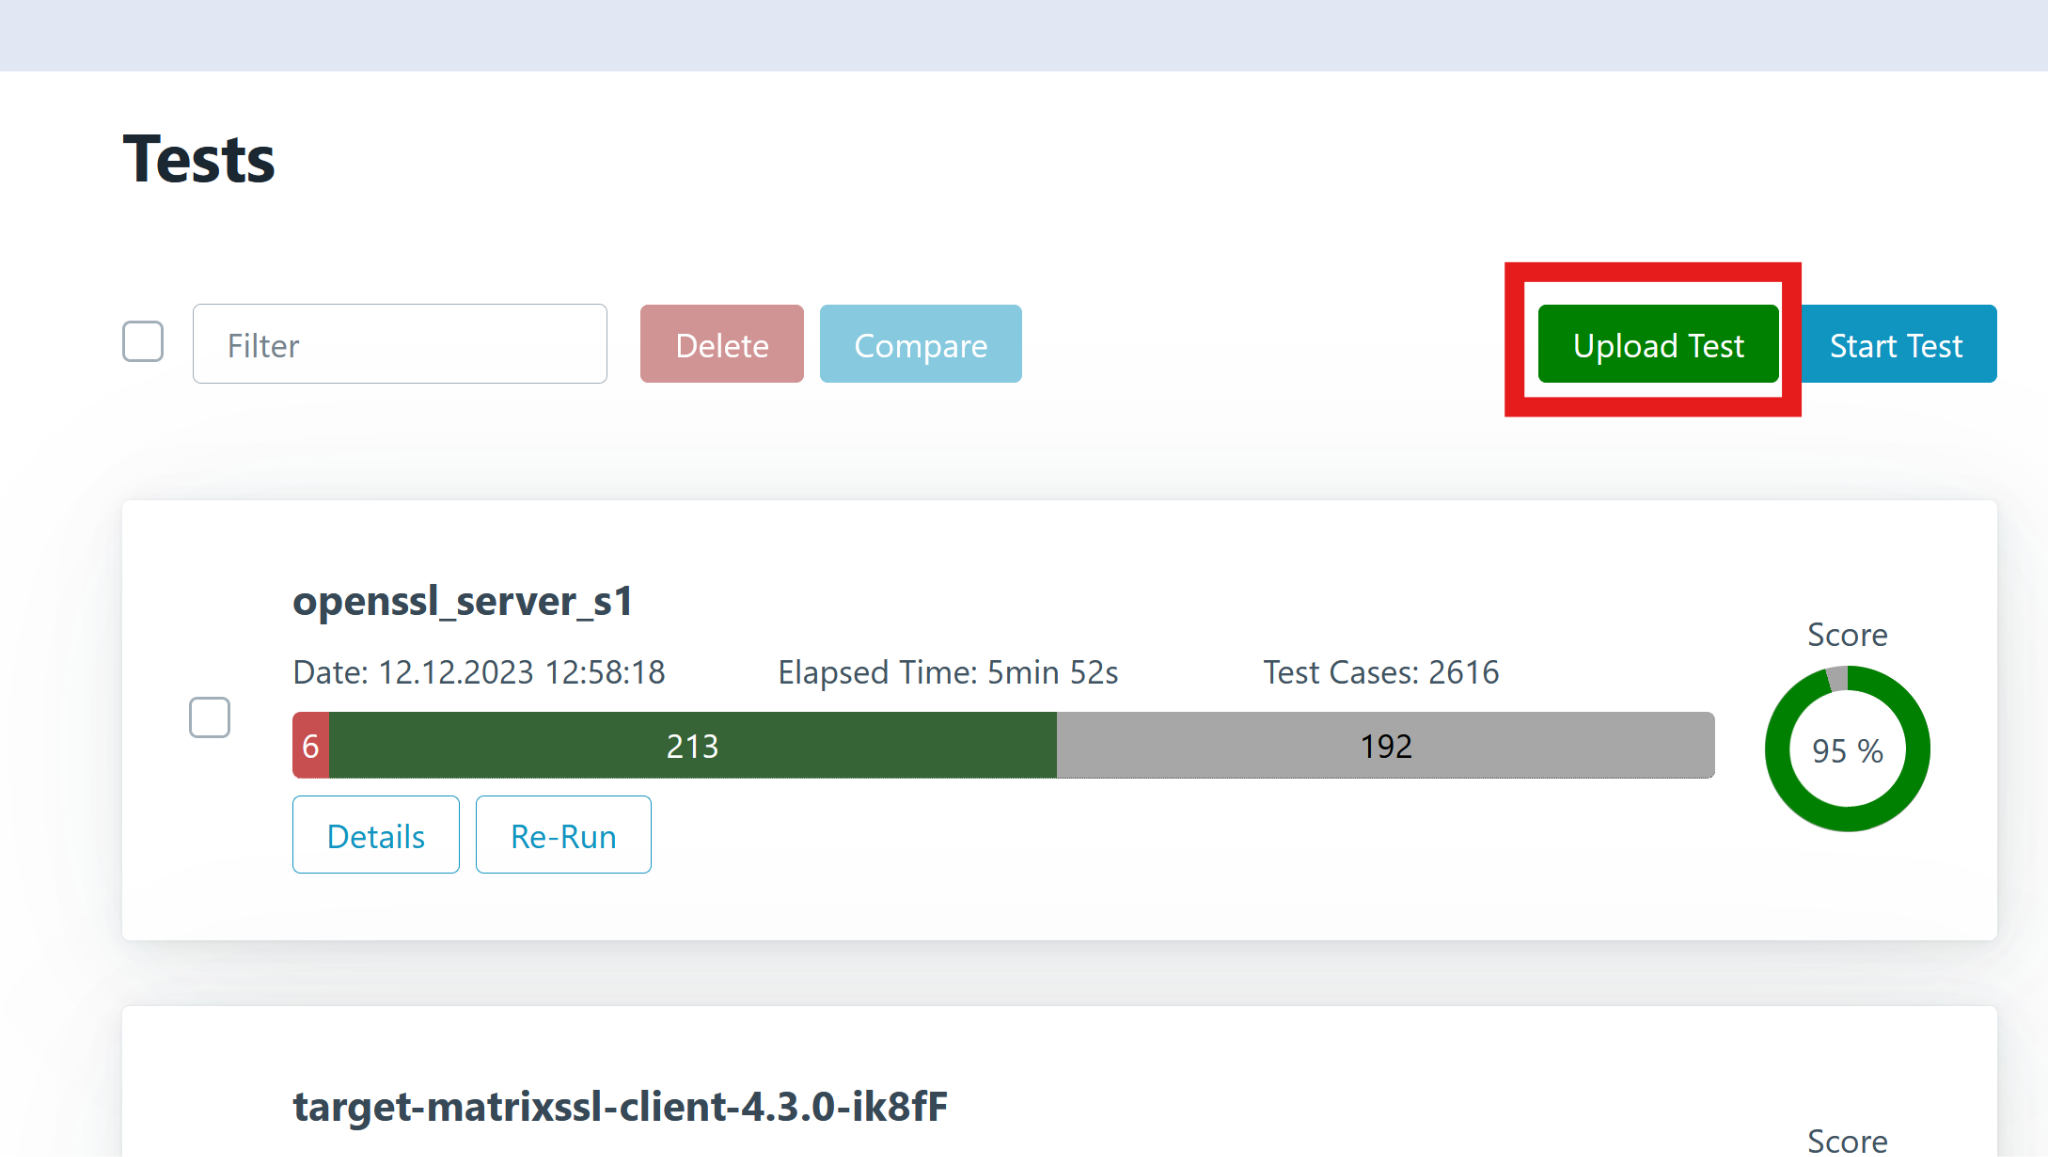
Once imported, the test report can be opened and analyzed. Click Details to view the report overview.
Report Overview
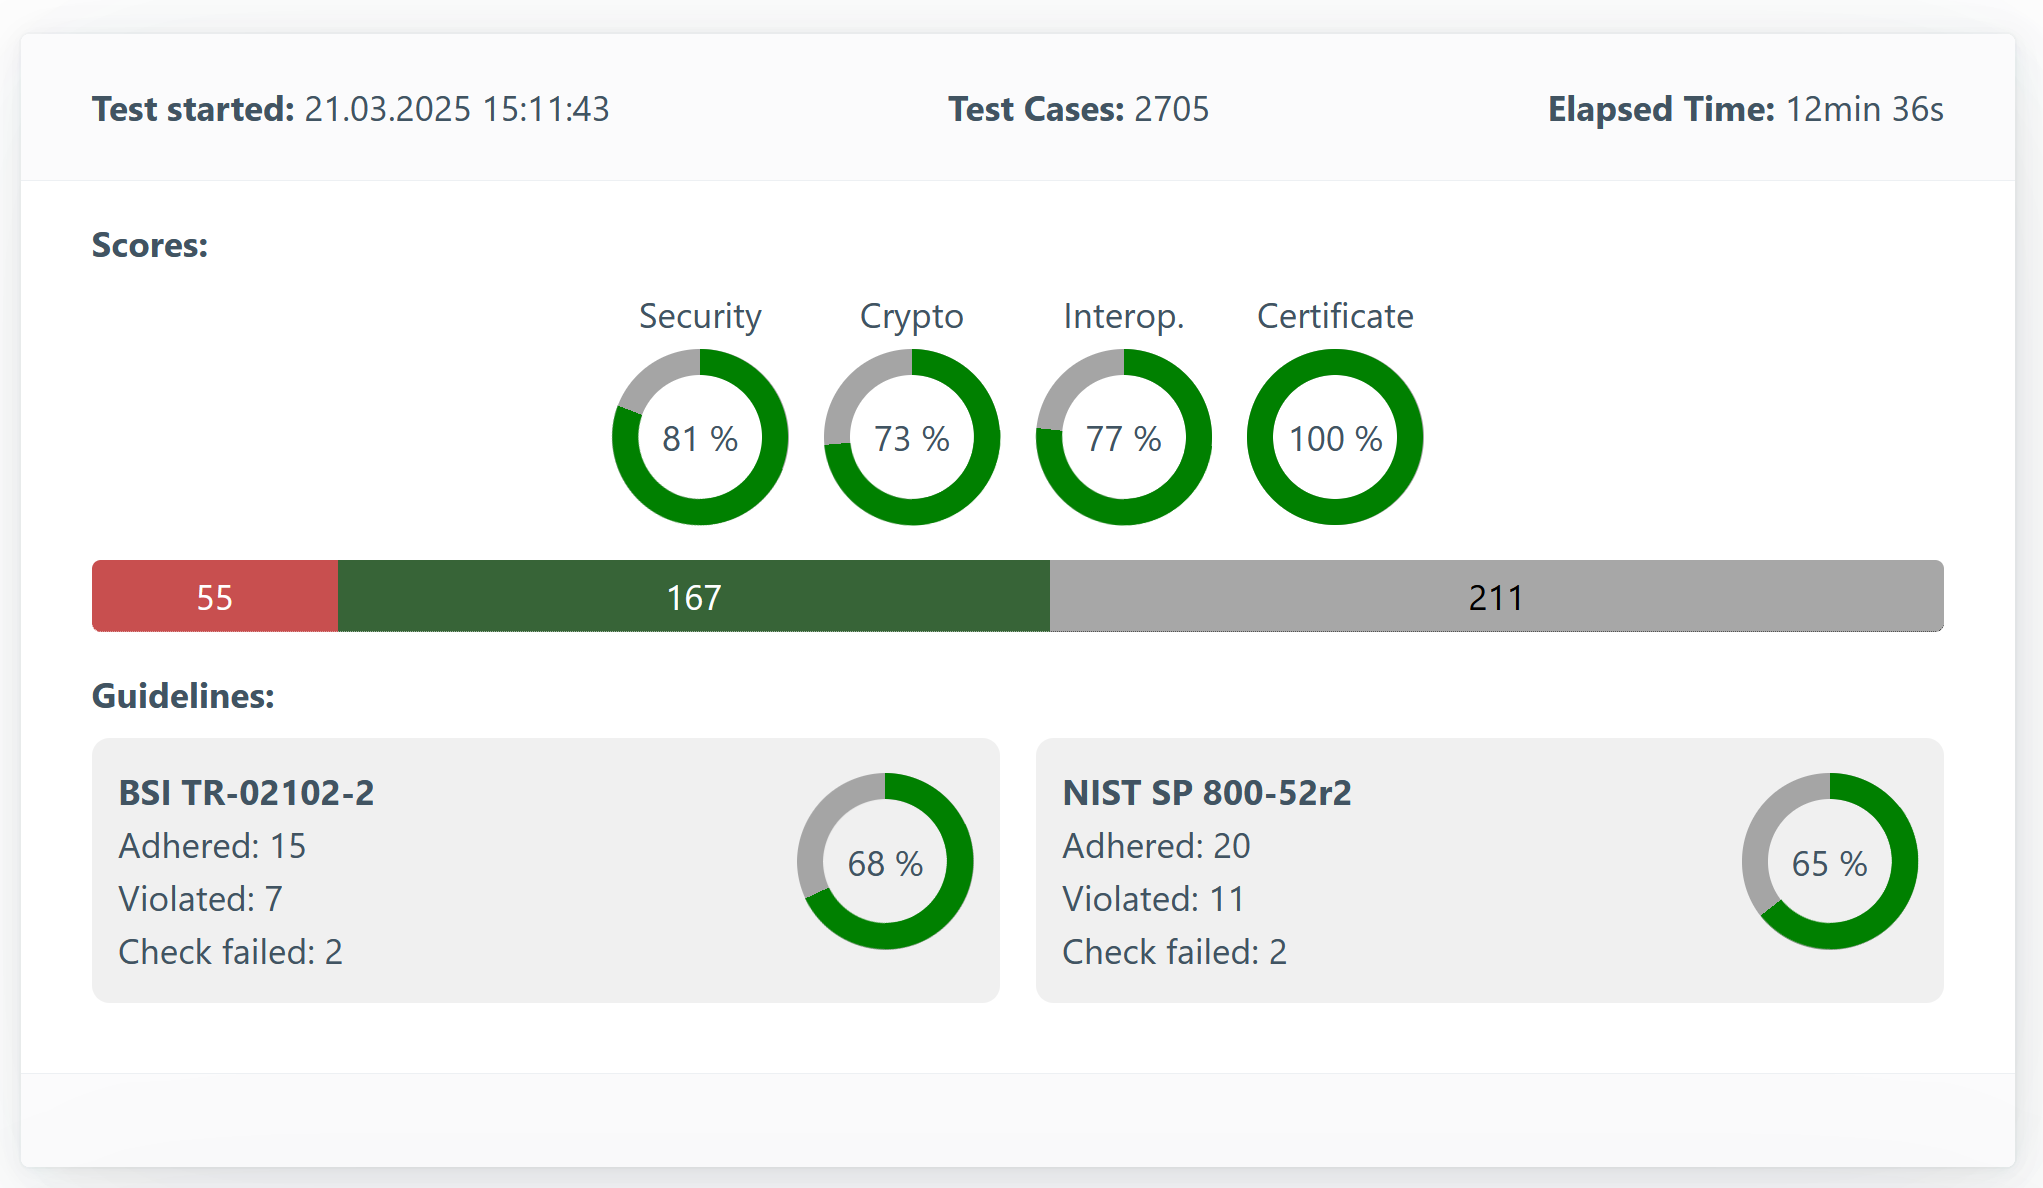
The Report Overview provides a high-level summary of the scan results.
- Test Started: Timestamp of when the test began.
- Test Cases: Number of handshakes performed (dependent on test strength and active filters).
- Elapsed Time: Total duration of the test.
- Scores: Summary of test outcomes grouped by category.
- Test Bar Colors:
- 🔴 Red: Tests with errors
- 🟢 Green: Successful tests
- ⚪ Gray: Skipped or unsupported tests
- Guidelines: There are various guidelines that stipulate which configuration TLS servers should have. Among others, the BSI prescribes how to secure a TLS server in its technical guideline TR-02102-2. The American NIST has a similar guideline. Tests are carried out here against these guidelines. This has nothing to do with actual errors in the implementation, as in the test runs below, but with the configuration of the server. The guideline check is performed by TLS-Scanner and is only additionally integrated here.
Report Analysis
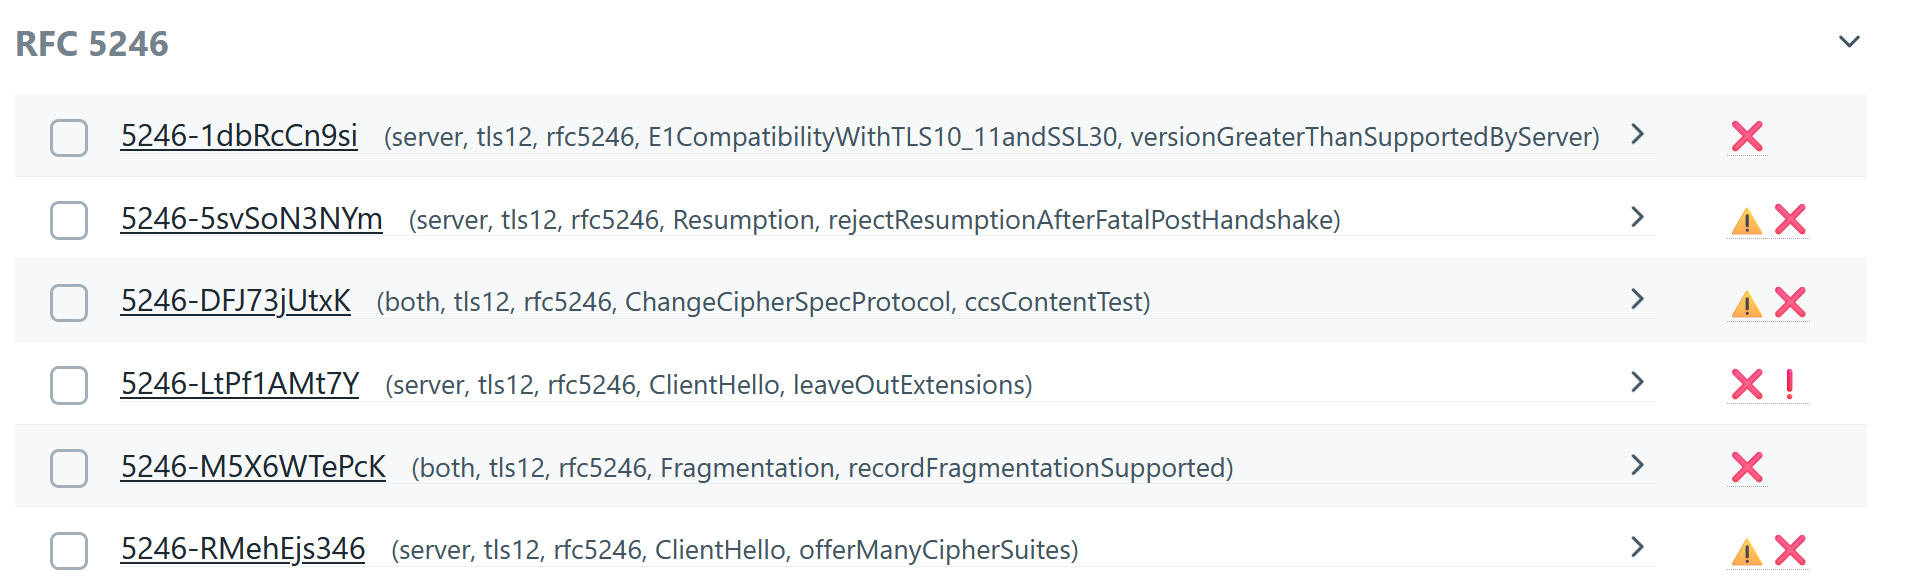
Below you'll find a breakdown of test results grouped by test run and RFC.
Most tests map directly to RFCs, which define expected TLS behavior.
For example, RFC 8446 defines TLS 1.3.
Each test is uniquely named using the format: [RFC number]-[Random letters].
Filters
You can filter tests based on the following properties:
-
Name: Includes the RFC number. Supports full-text search.
-
Tags: Metadata such as:
- Protocol version:
tls12,tls13 - Target:
server,client,both
- Protocol version:
-
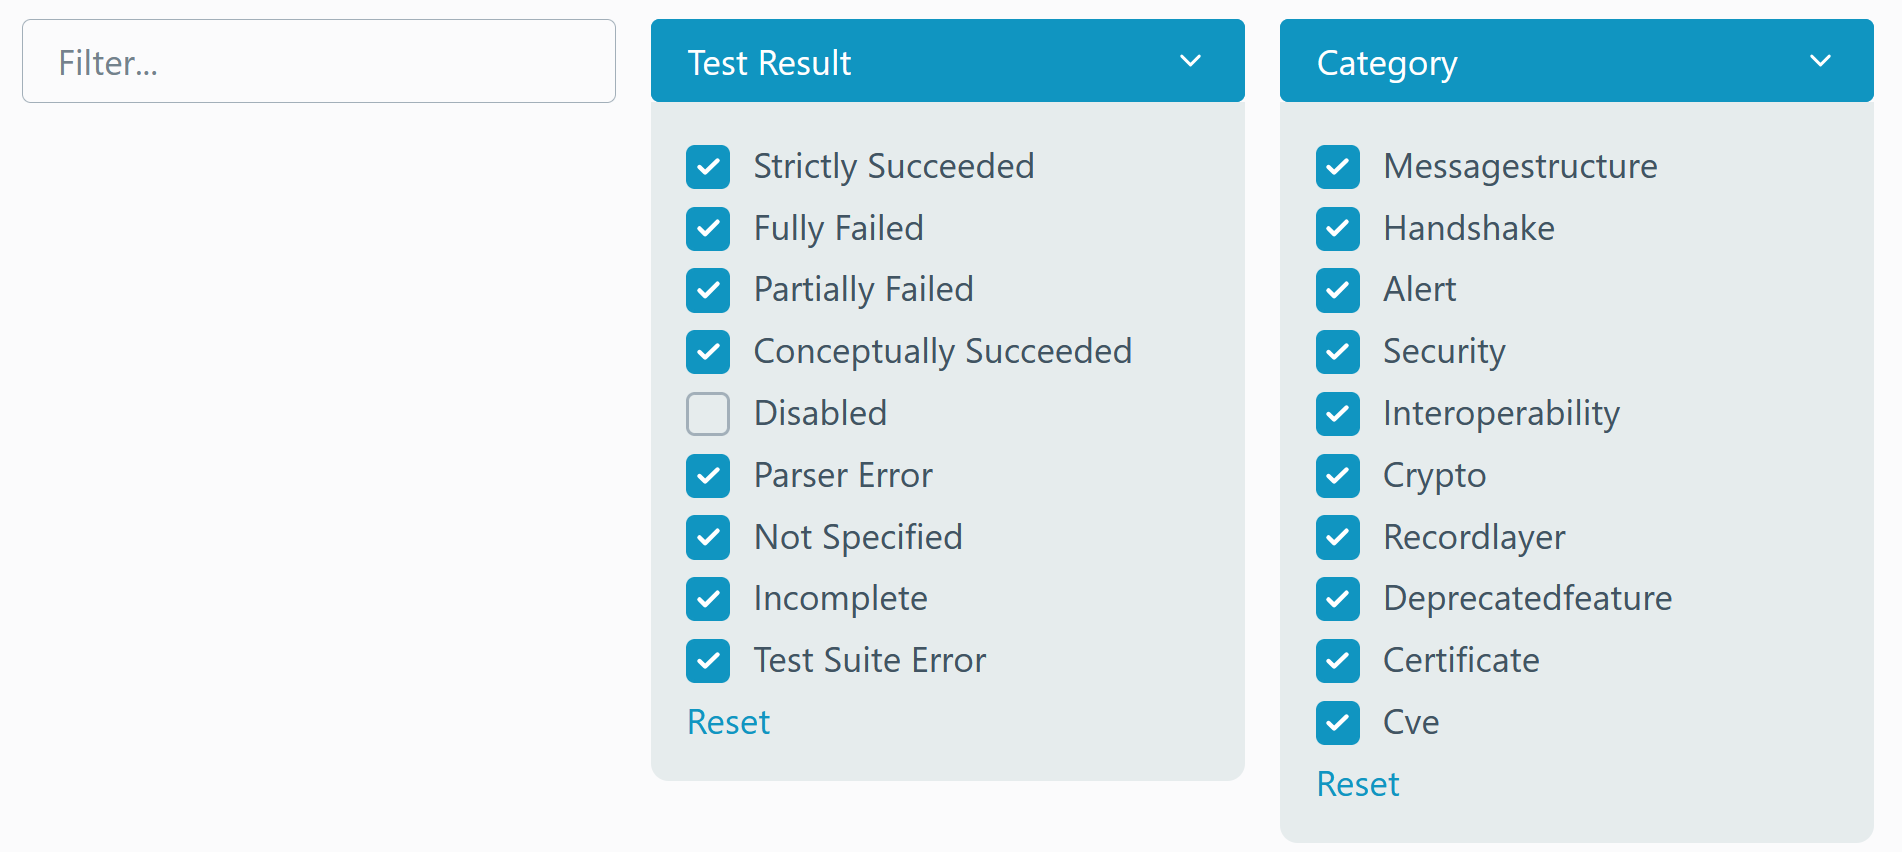
Categories:
MessageStructure– Verifies the structure of TLS messages.Handshake– Analyzes handshake protocol behavior.Alert– Evaluates the use of alert messages.Security– Tests security-related requirements. Failures may indicate vulnerabilities.Interoperability– Failures could indicate compatibility issues with other implementations.Crypto– Evaluates cryptographic correctness.RecordLayer– Verifies the TLS Record Layer.DeprecatedFeature– Detects the use of outdated features.Certificate– Assesses certificate-related behaviors.CVE– Identifies known vulnerabilities.
-
Test Result:
- Successful
- Strictly Succeeded: Fully passed.
- Conceptually Succeeded: Passed, but the connection was closed unexpectedly.
- Failed
- Fully Failed: All parameter combinations failed.
- Partially Failed: Some parameter combinations failed.
- Execution Error (useful for developers)
- Parser Error
- Not Specified
- Incomplete
- Test Suite Error
- Disabled: The test was skipped due to unsupported features or manual exclusion.
- Successful
Debugging a Library
-
Filter by Failed Tests
Click the red portion of the test bar or manually select "Fully Failed" and "Partially Failed". -
Review Each Failed Test
Click each failed test to analyze the issue.
-
Hide Completed Tests
Once evaluated, mark the test using the checkbox to the left.
This hides it and moves it to the Hidden dropdown.
You can reveal hidden tests using:- Reset Hidden (to show all)
- Removing the checkmark individually
Test Run Evaluation
Testrun Overview
Clicking a specific test run reveals:
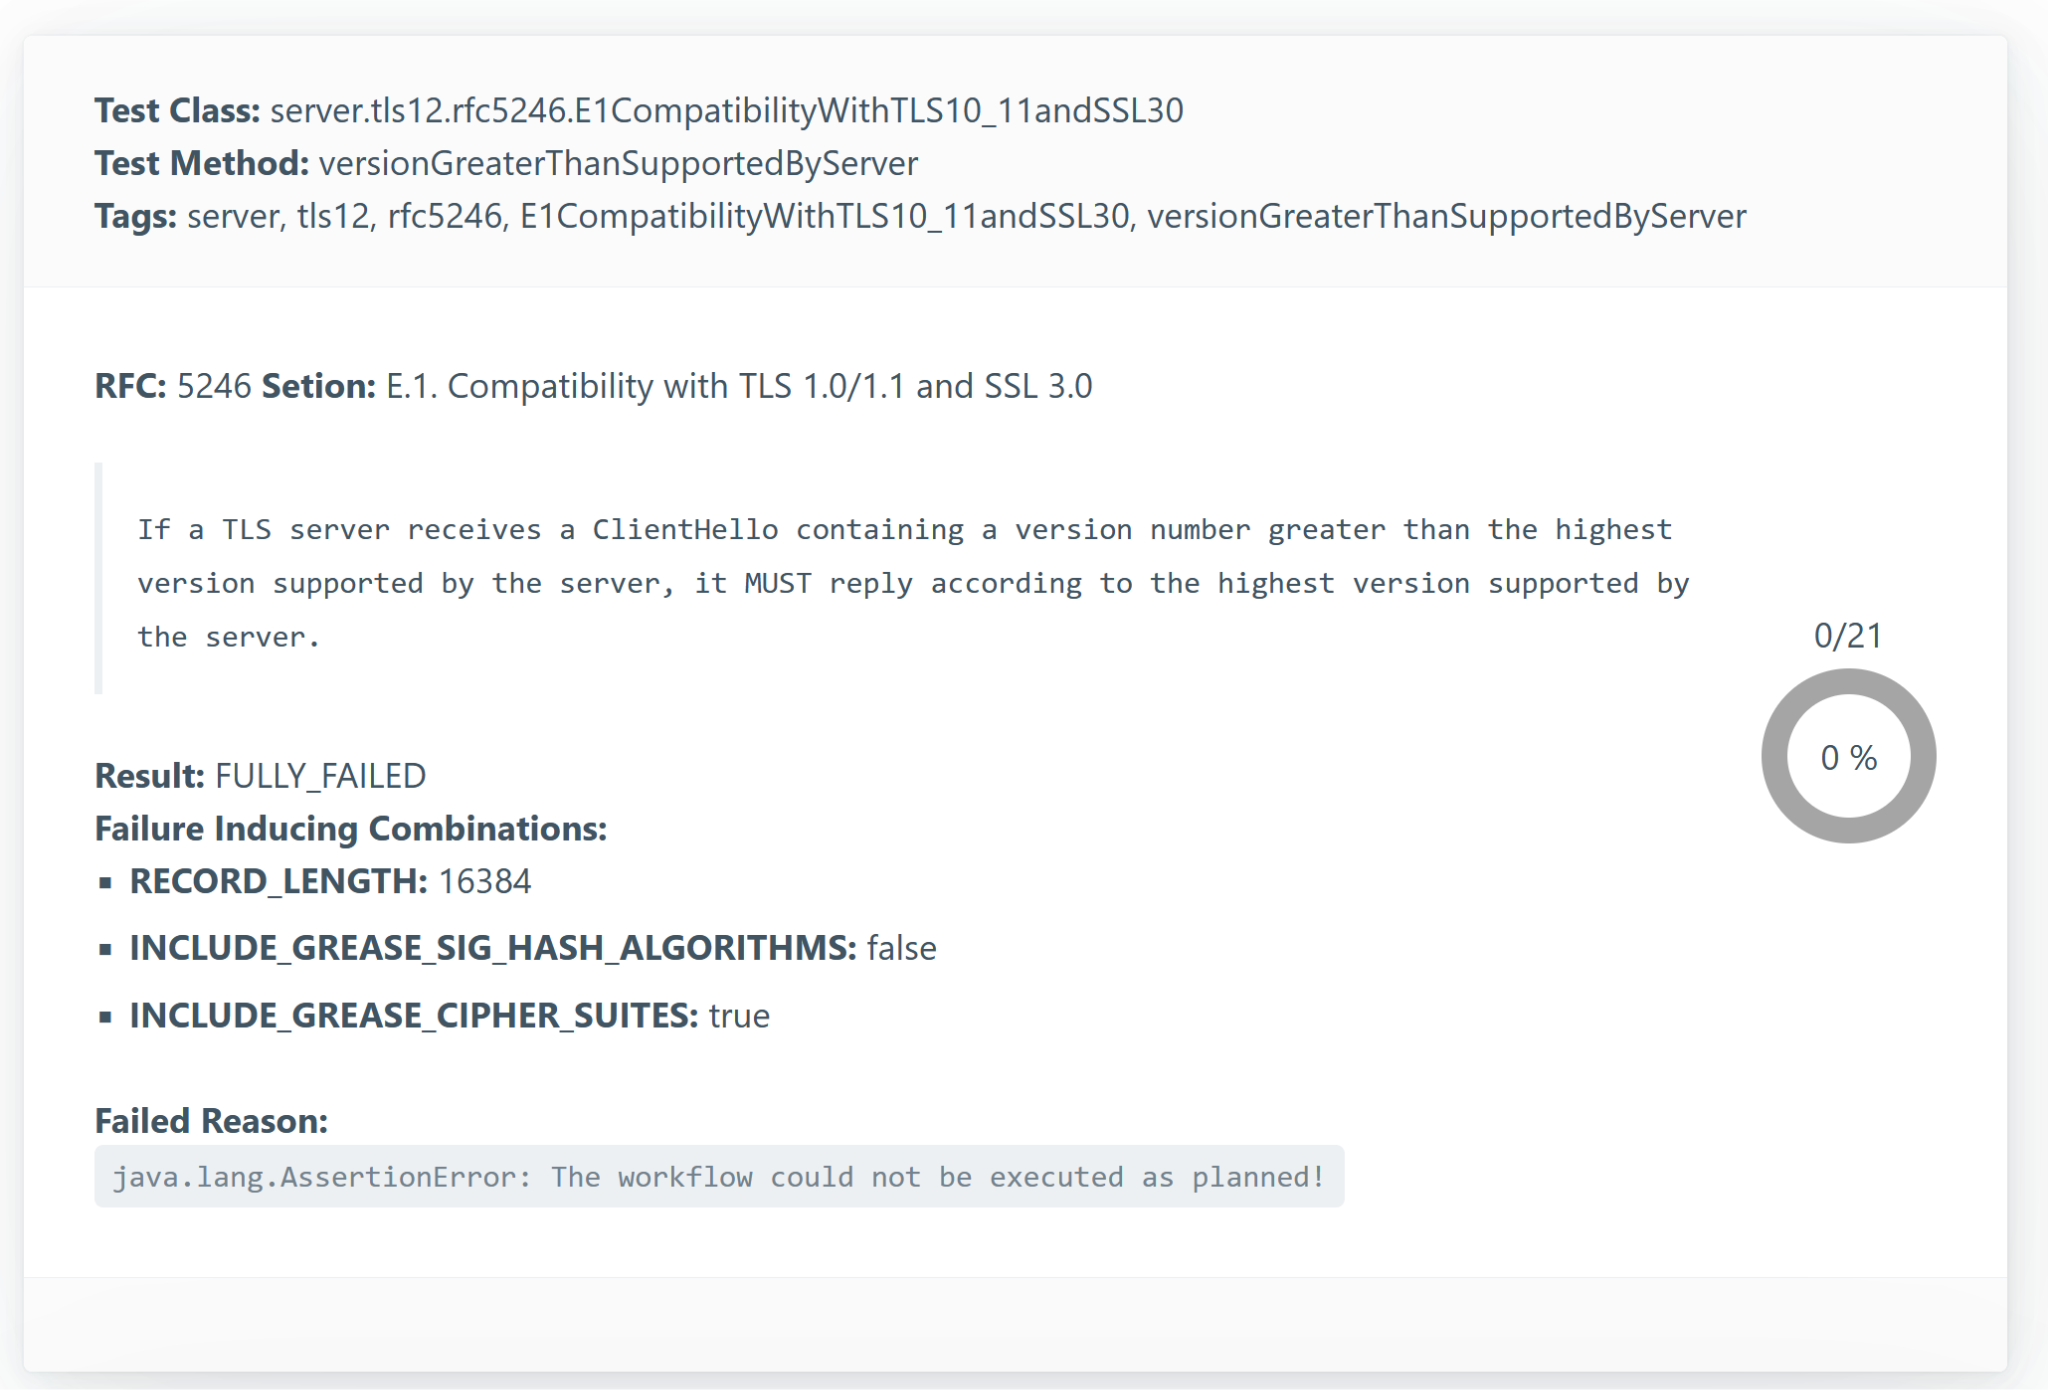
- RFC: The RFC governing the test, including a direct quote and section reference.
- Result: Outcome of the test, along with the number of handshakes sent and passed.
- Fully Failed = 0 successful
- Partially Failed = Some but not all successful
- Strictly/Conceptually Succeeded = All successful
- Failure-Inducing Combinations: Lists which parameter values likely triggered the failure.
- Failed Reason: A textual explanation of the failure (may be vague—review handshakes for clarity).
Handshake/Test Case List
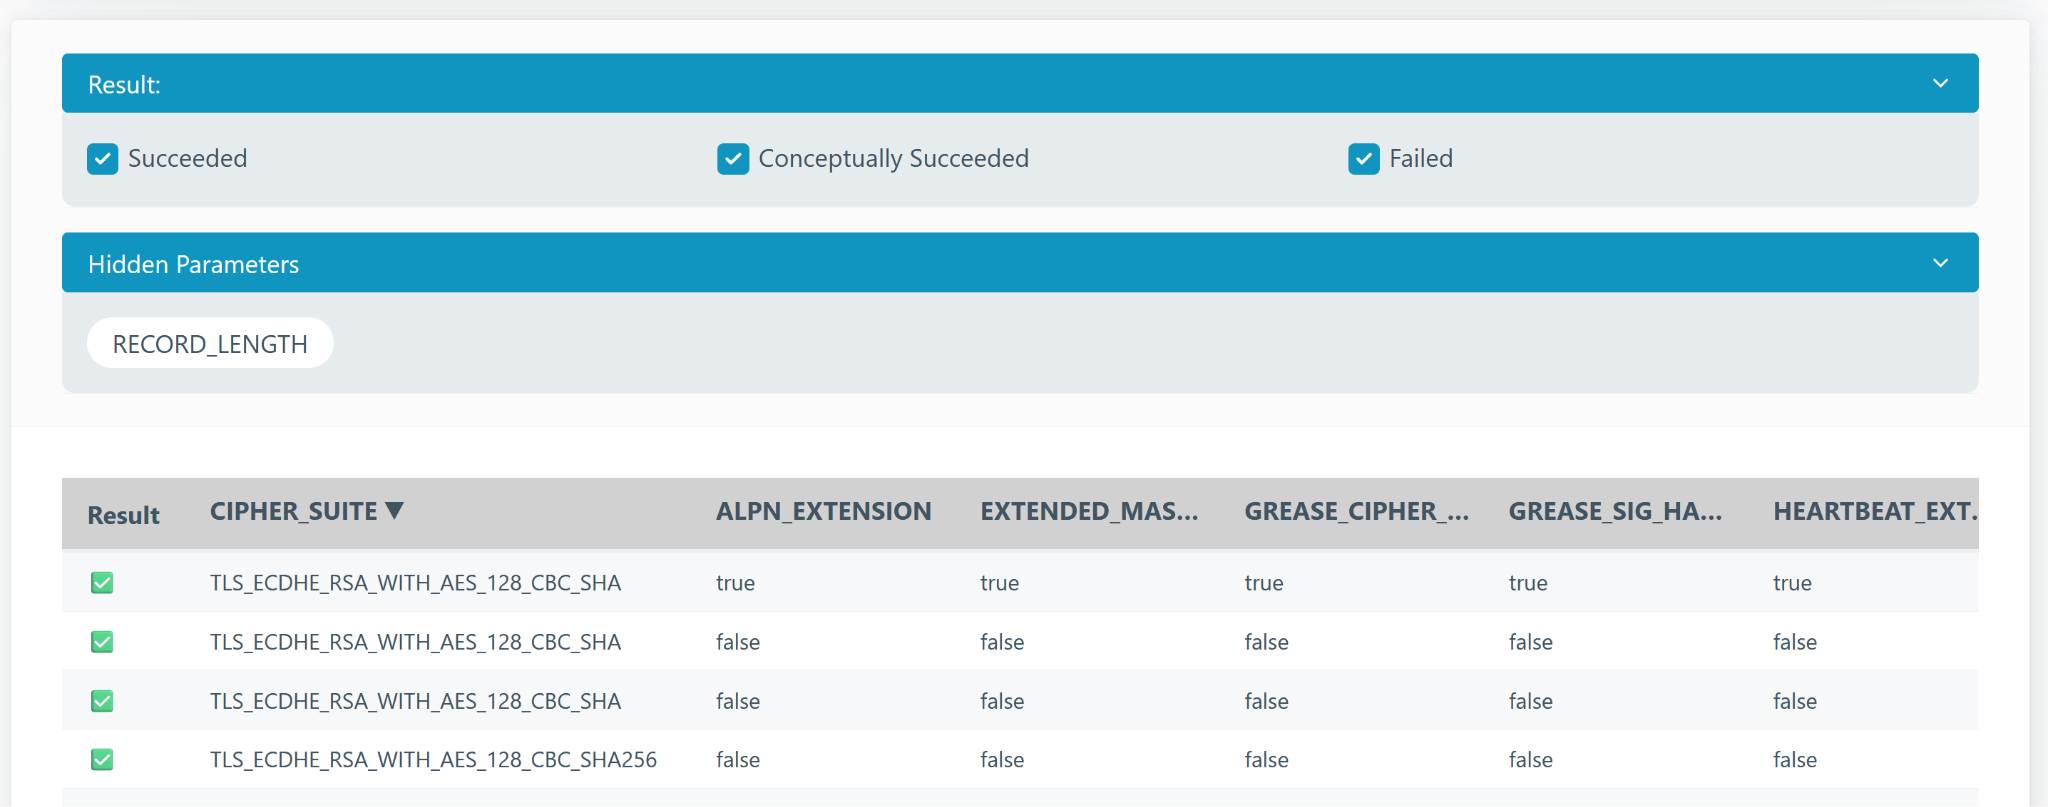
Each test run typically includes several test cases with different parameters. These handshakes are shown in a sortable table.
- For Fully Failed tests, any handshake is valid for analysis.
- For Partially Failed, sort the table by parameters to identify patterns.
- Use the arrow next to column headers to sort.
- Click the header to hide the column (it will appear under “Hidden Parameters” above the table).
In simple cases, only one parameter affects the outcome. In complex cases, use the Failure-Inducing Combinations for guidance.
Detail View
Clicking a handshake shows a detailed view.
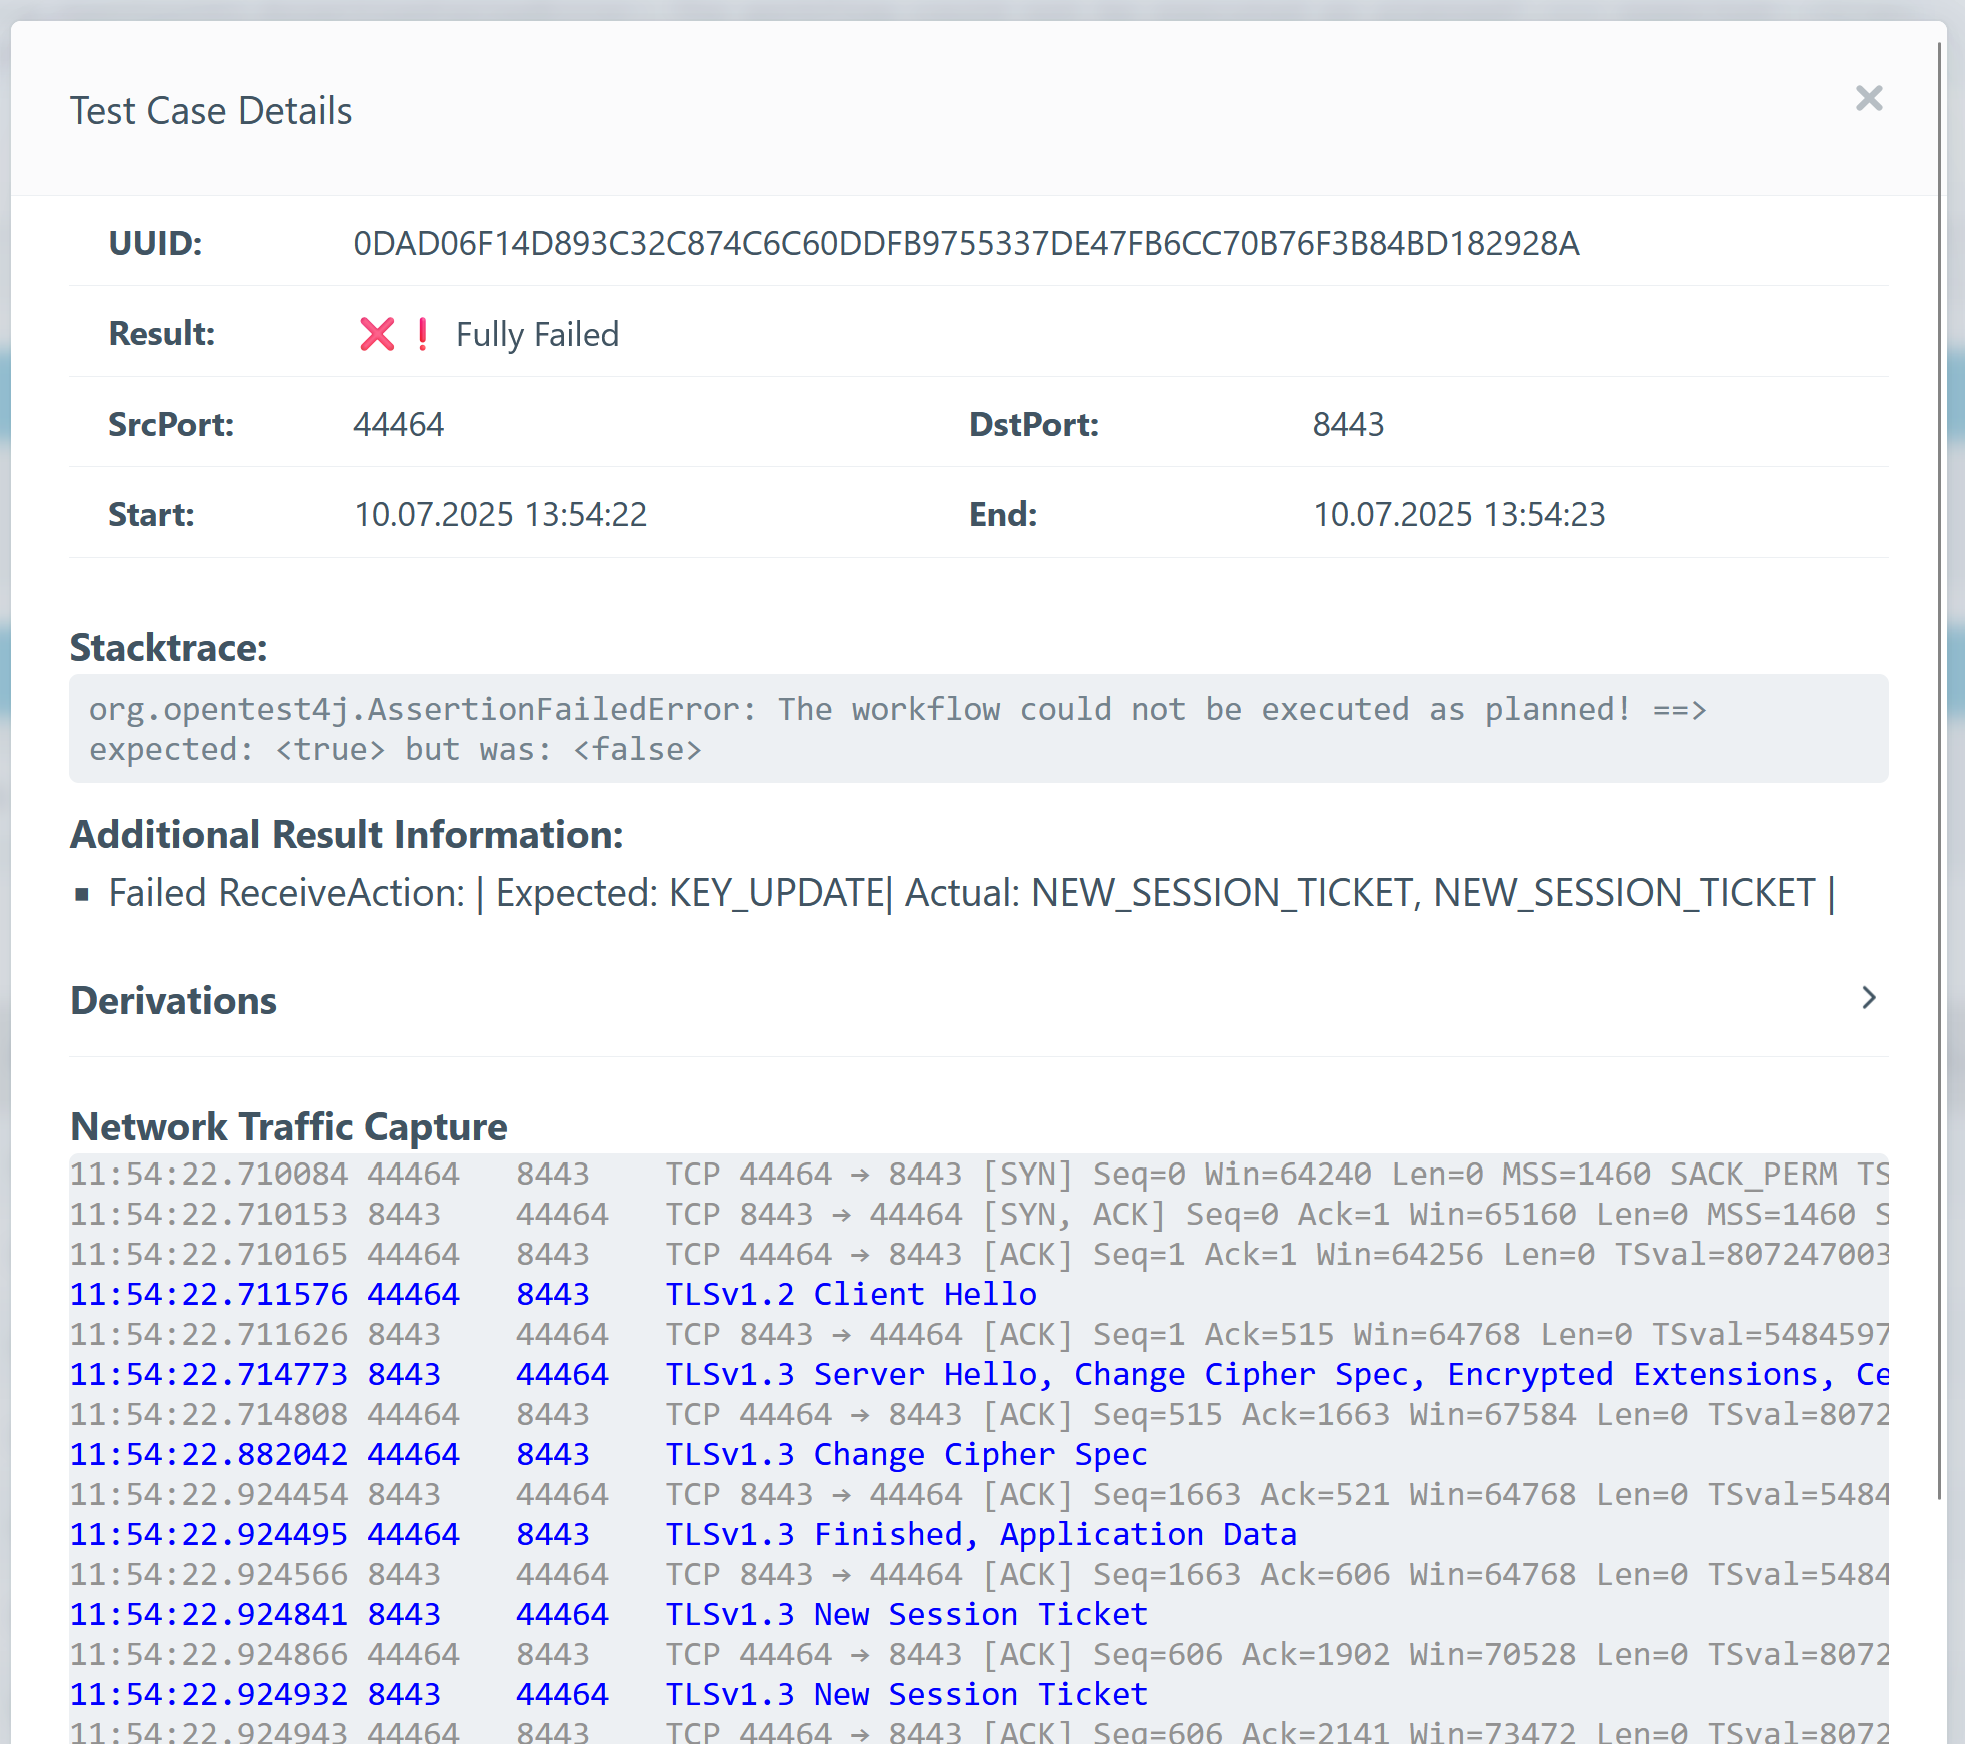
Key elements include:
- Result: Final outcome of the handshake.
- Stacktrace: The reason the test hase failed.
- AdditionalResultInformation: May contain insights into failure causes.
- Derivations: Specific parameters used in the test.
- Network Traffic Capture: View the sequence of TLS messages.
- TLS messages are highlighted in blue.
- Download the full PCAP for analysis in tools like Wireshark.